With the Super Bowl getting further in the rear view mirror, and the sports world turning their attention on March Madness and the final stretch of the NBA and NHL seasons, it got me thinking about a common gripe among fans of certain sports: “there’s no disparity in the league.” From the Patriots making the AFC their playtoy for much of this millennium, to whatever team Lebron James being on making the finals 8 years in a row, including 4 straight Warriors-Cavaliers finals matchups, which major North American sports league has the least volatility? The answer probably won’t surprise many: it’s the NBA. In a sport where only 5 players from each team are on the floor at a time, and team rosters are less than 15 people, individual players carry more responsibility and value in their team’s success than in the other sports, where a lot is placed on pitchers in the MLB, but even the best pitchers are responsible for covering less than a fifth of their team’s innings, quarterbacks get all the attention in the NFL but rosters top 50 players, and the NHL has goalies that are very important but rely on getting help from the skaters on the ice with them. When you look at various measures of disparity in a league, from standings changes from the middle of the year to the end, to how many different playoff teams there are every year, to how reigning champions perform in the year after their title, the NBA regularly shows less volatility than the other major sports leagues.
Since 2000, we looked at standings changes from halfway through the season to the end, looking at how many teams went in or out of a playoff spot, and what teams had their playoff seed change. We looked at the same differences from the 75% mark in the season. We looked at whether or not the prior year’s champion made the playoffs, and if that year’s champ was in the playoffs the year before. We checked how many teams in one year’s playoffs had and had not been in the playoffs the year before. Lastly, we checked how many teams repeated going to the finals and/or conference finals every year. When looking at these numbers, it’s important to note the differences in the playoff formats of the 4 major leagues. The NBA and NHL both send 16 teams, 8 from both the Eastern and Western Conferences, while the NFL sends 6 teams from each conference, and the MLB after many years of inviting 4 teams from each league added a fifth team from both leagues starting in 2012. We put not only the pure numbers, but also the percentages of teams for all the data points we looked at between the leagues.
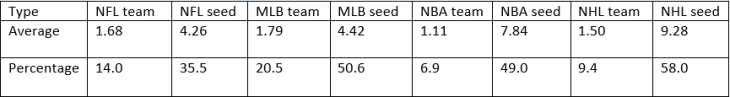
50% changes
For the NFL, we used standings after week 9 for the halfway point, while with the other leagues we went to the exact day that half of the leagues games were played.

From this data, we find that it seems like the more teams that you have in the playoffs, the less change their is, with the NBA and NHL both having very low numbers for team changes but high numbers for seed changes, as teams do still move around a bit but a teams that got out to a really good start isn’t going to totally miss the playoffs, whereas in the MLB or NFL it’s easier to lose a playoff spot. Overall, it looks like the MLB has the highest volatility for this data, with a team change that’s easily the highest (and even having the highest raw average despite the fewest playoff teams) and a seed change that’s right there with the NBA and NHL who have less than half the team change that the MLB does. The NFL and NBA are the two worst here, with the NFL having the most seeds locked up at the midway point while the NBA rarely has teams move into the playoffs if they weren’t in position at the halfway point.
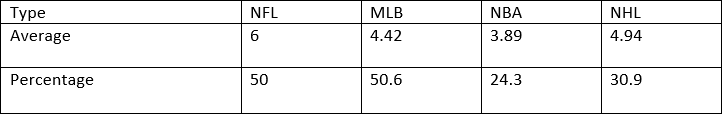
75% changes
The 75% changes unsurprisingly went very similar to the 50% changes, although the NHL put more of a gap on their lead in seed changes. The MLB still did way better at having teams changed and topped the NFL and NBA in seed changes despite having fewer playoff teams. So once again we have the MLB and NHL looking more volatile than the NFL and NBA.
Playoff teams changing year to year
For this we looked at playoff teams and checked if they were in the playoffs the year before. One note for this one is the MLB’s playoffs have expanded in our time frame, so they had to have at least 2 new teams in 2012, when they went from 8 to 10 total playoff teams. They had 6 teams make the playoffs that year who had missed in 2011, tied for the second highest total we saw. They also had 7 of 8 playoff teams change from ’06-’07, so I didn’t worry about the possible inflation from expansion. All the other leagues have seen more teams added to their league since 2000, so they’ve all had expansion drafts that can make things weird too.
Here, we once again see the difference that having more teams make the playoffs causes, with the NBA and NHL trailing the NFL and MLB. I’d say the NFL did this better than the MLB despite the fact that their percentage was slightly lower because of the trends we’ve seen already in total playoff teams. The NHL clearly did better than the NBA, who averaged the fewest new teams in the playoffs despite having way more teams in the playoffs than the MLB. A midpoint “standings” for the leagues would show the MLB at #1, the NHL #2, the NFL #3, and the NBA needing to show more disparity at #4.
How champions fared before/after they won it all
Here we looked at all champions and how they did in the year before and after they won the title, and displayed it as yearly questions of: Did last years champ make the playoffs? And: Was this year’s champ in last year’s playoffs? It becomes worth noting at this point that the NHL has played one fewer season than the other 4 leagues due to the lockout completely taking out the 2004-2005 season. We ignored the gap and treated the ’05-’06 season as though it directly followed the ’03-’04 season, and the NHL just has one less data point than the other leagues.
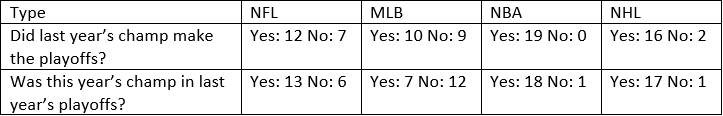
This is where the NBA pulls away from the NFL for least volatile of the major North American leagues. No champion has missed the next years playoffs since at least 2000. The only time a team went from not making the playoffs to winning the championship was the ’07-’08 Boston Celtics team that had Paul Pierce get hurt the year before, then formed their big three by adding Ray Allen and Kevin Garnett that offseason. The NHL was only barely better in that 2 times champions missed the playoffs the following seasons, and those numbers make sense when over half the teams in both of those leagues make the playoffs every year. If you take NFL champions that aren’t the New England Patriots since 2000 the NFL numbers look a bit more like the MLB: last year’s champ in the playoff would go to 8-6 instead of 12-7, and the champ in last year’s playoffs would go to 9-4 from 13-6. The MLB once again crushed the other leagues, and sure you can blame the ’03 Marlins who sold everything after winning the World Series, or the Red Sox in 2012-’14 who went last in their division-World Series win-last in their division, but baseball is just like that sometimes. It has disparity, it’s wild sometimes.
Semifinals/Finals repeaters
One last way we thought to measure the disparity in a league was to check out how often teams repeated in the finals or conference finals/league finals (semifinals). Like the last category, we don’t need to compare percentages because every finals are two teams and every semifinals are 4 teams.
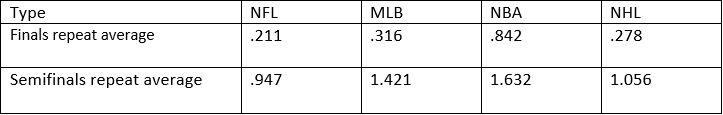
One of these things is not like the others. The NBA has had 4 seasons since 2000 that featured the same 2 teams as the year before. The Cavs-Warriors 4 in a row counts as 3 of those, with Lebron’s Heat and the Spurs going at it in back-to-back years being the other. The other 3 leagues have a total of one finals rematch: the NHL’s Red Wings vs Penguins in the 2008 and 2009 finals was the only one. The MLB finally has something they’re not arguably the best at, Thanks in part to the Dodgers going to back-to-back World Series the past two years, catching the tail end of the Yankees dominant period from 2000-2002, and having at least one team repeat in their league’s Championship Series every year since 2008.
Overall Disparity Rankings
#1:  (#1 in 3 categories)
#2:  (barely beat NFL thanks to in-season volatility)
#3:  (#1 in 2 categories, but playoff seeds lock up fast)
#4:  (Last in all 5 categories)
This is why the NBA has more issues with tanking than other leagues. Teams know going into a season that they don’t have a chance to make the playoffs, when in other leagues teams can at least think “crazier things have happened.” This is great for general managers, who can head into a season knowing what the expectations are. Lately, teams outside of Northeast Ohio and the San Fransisco Bay knew they weren’t likely going to reach the finals, allowing teams to reasonably conclude that they should just get under the luxury tax and wait out the dominant period that the Warriors and Cavs were having. It’s not so great for the fans of those teams, who thought their team probably had a good chance and either couldn’t or didn’t want to take advantage of it. The MLB and NFL it seems like have a bit of a problem in the complete opposite direction where fans of some teams go into every season thinking they can make the playoffs. For example, being from Michigan I heard sports radio shows talking about if the Lions could make the playoffs last year when they were clearly worse than the Vikings, the Packers were expected to be better, and the Bears were expected to improve as well. It didn’t stop until at least week 10, by which point the Lions were 3-6. When the Tigers hovered around .500 into May, people would call in to sports radio talk shows and say the Tigers should trade for some player or two and go all-in. They ended up going 64-98, 27 games behind the division-winning Indians. So the NBA has certain advantages in its lack of disparity. In no other sport would fans accept a team publicly stating they were going to lose for multiple years. In football they’d say they just need to get the right QB, hockey fans might say the same thing about a great goalie. Baseball fans would think you can get back into contention after one or two down years, not a 4+ year process. I’ll take the MLB, where you can turn things around mid-season, or over a short period of time in an offseason or two, and you don’t end up watching the same teams in the playoffs year in and year out. Until next time,
CM
Historical info courtesy of sports-reference.

Leave a comment